Program Objectives
Overview
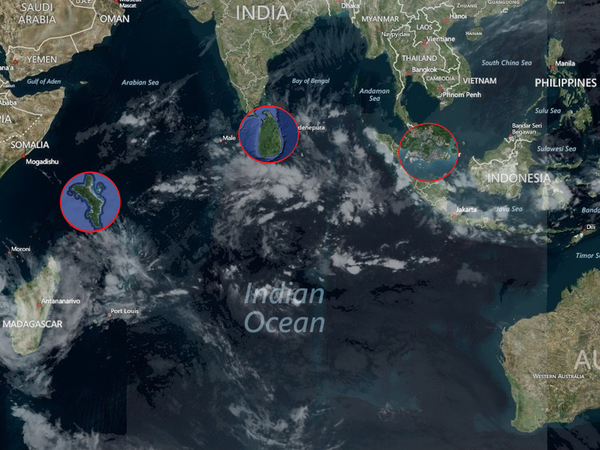
The ASIRI: RAWI project is a research program designed to capture and study intraseasonal phenomena by observing across the equator with measurement stations at eastern atolls of Seychelles and Sri Lanka and Singapore, spanning time scales from minutes to months. It is funded by the Northern Arabian Sea Circulation Autonomously Researched (NASCar) Initiative of the Office of Naval Research (ONR).
The equatorial Indian Ocean is considered a hot spot of Earth’s weather and climate variability. Akin to this pervasive influence is the coupling of energetic, small to decadal scale, atmospheric disturbances originated over the Indian Ocean (IO) with a myriad of oceanic processes, the understanding of which remains nascent. On the subseasonal scale, the active and break phases of South Asian monsoons trigger remarkable response in both the atmospheric and oceanic sides, and the origins of these oscillations have been attributed to equatorial disturbances, for example, the Madden Julian Oscillations, planetary waves, transients of Hadley circulation and Kelvin-Rossby wave packets. Conceivably, smaller scale processes such as convection and turbulent entrainment can be the triggers for these phenomena. Despite their importance, in-situ data available from the IO on subseasonal phenomena are scant, and to understand coupled, multi-scale variability it is necessary to sample key phenomena at appropriate scales. We propose a research program to capture and study intraseasonal phenomena by observing across the equator with measurement stations at eastern atolls of Seychelles and Sri Lanka and Singapore, spanning time scales from minutes to months.
The aim is to:
- capture eastward and northeastward propagating disturbances over one year using profiles of moisture and velocity
- observe entrainment of upper air into the marine boundary layer using LiDAR and ground (tower) based measurements
- delineate the role of small-scale atmospheric processes in determining air-sea property exchanges
Data of international observational networks, as well as simulations of the Weather Research and Forecasting (WRF) model, will augment the analyses. The project has an outreach component, wherein governmental and non-governmental organizations as well as universities from Sri Lanka, Seychelles and Singapore will be participating in observations and analysis.
Scientific question: Small-scale processes
Through the measurement of the position of the entrainment interface (microwave radiometer) as well as the vertical and horizontal velocities (VAD modes of LiDAR), it is possible to measure the rate of entrainment as a function of the gradient Richardson number. This measurement can be used to estimate the downward buoyancy flux at the entrainment interface, and near-surface tower measurements will provide information on the buoyancy flux at ground level. Some questions to be answered, using measurements at all stations, are:
- What is the vertical structure of winds, temperature, mixing ratio and Richardson number? How does this change from the transition period of monsoons to fully developed monsoons and during monsoon breaks?
- What is the entrainment rate as a function of the (interfacial), Ri-g.? Are these changes in consonance with the shear-breakdown mechanism proposed by Bhat & Fernando (2014) as well as laboratory findings of Strang & Fernando (2001)? What is the contribution of convective activities?
- How does the interfacial, Ri-g. change with the onset and continuation of monsoons? And, can it sustain a substantial downward buoyancy flux?
- Is the entrainment possible at, Ri-g. > 0.25, and how long does this entrainment last? How does the interfacial stability (Richardson number) change during an entrainment event?
- How do surface energetics, including incoming and outgoing solar radiation and surface buoyancy flux, evolve?
- Do the eastward- and northward-propagating disturbances modify the entrainment mechanisms? Time lagged observations from Seychelles and Sri Lanka will be helpful in this regard.
Scientific question: Large-scale disturbances
The large-scale disturbances are discussed below:
Using equipment deployed for at least a year and data from observational networks, we will investigate the following:
- Are there [oscillatory] convective activities in the two sites? Climatological information suggests that the main MJO initiation takes place in the central IO from October to March, with the highest occurrence probability near the equator during October to January (Zhang & Dong 2004). The observations of the Dynamo Experiment were made during October to March 2012 (Yonayama et al. 2013), and the proposed winter and summer observations will add value to or complement those from Dynamo.
- What are the generation mechanisms of northeastward propagating equatorial disturbances? One of the suggested mechanisms is related to a positive shortwave-radiation anomaly that develops north of equatorial convection region. It warms up the sea surface, increases the low-level convergence and moist static energy and destabilizes the atmosphere, thus leading to northward propagating equatorial convection. This and other plausible mechanisms will be pursued via observations.
- Is there coherence between observations at our locations? We will analyze the surface pressure, temperatures and upper-level moisture (mixing ratio and liquid water content). What are the phase speed and wave length of propagating disturbances? Can we identify those using existing theoretical frameworks (e.g., westward-propagating Rossby waves, equatorial Kelvin waves)? The interest is not only eastward-propagating perturbations, but also the much slower, northward-propagating, component.
- What are the time scales of convective activities – their initiation, maturation and decay?
Simulation Using WRF Model
In addition to observations, simulations are conducted using the Weather Research and Forecasting (WRF) Model.
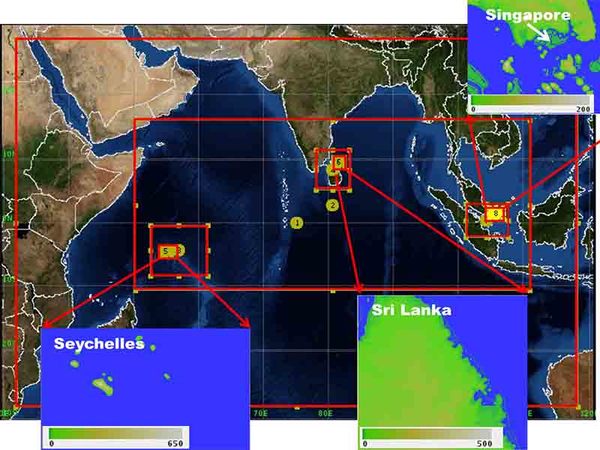
Nested domains for WRF simulations:
- Domain 1 with 64km grid
- Domain 2 with 16km grid
- Domains 3,4 and 7 (below 8) with 4km grid, and
- Domains 5, 6 and 8 with 1km grid.
The terrain height (color bar) is shown in meters.